The management reporting software
With LucaNet's software for management reporting, the relevant information is guaranteed to reach the proper recipients right on time.

This is what an ideal reporting software can do
LucaNet is your easy-to-use software for financial reporting. Benefit among others from:
- Predefined reports and evaluations
- Variance analyses, including traffic light function
- Interactive analysis function
- Full Excel integration, including pivot tables
- Open interfaces (e.g. XMLA, ODBO, MDX) for integration with existing report and analysis environments
Five surefire steps to implementing management reporting:
1
2
3
4
5
Only LucaNet simplifies complexity
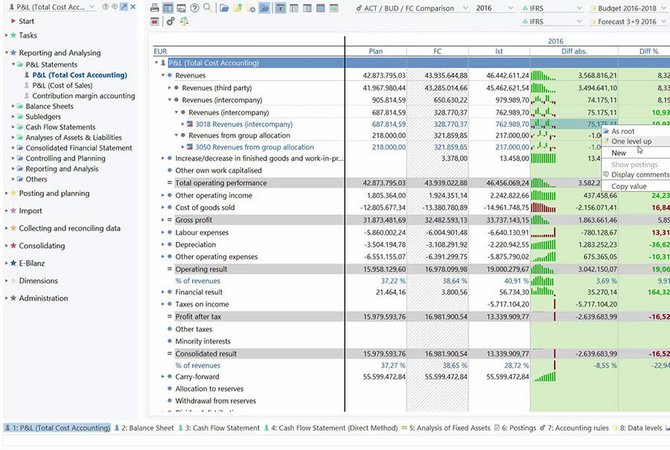
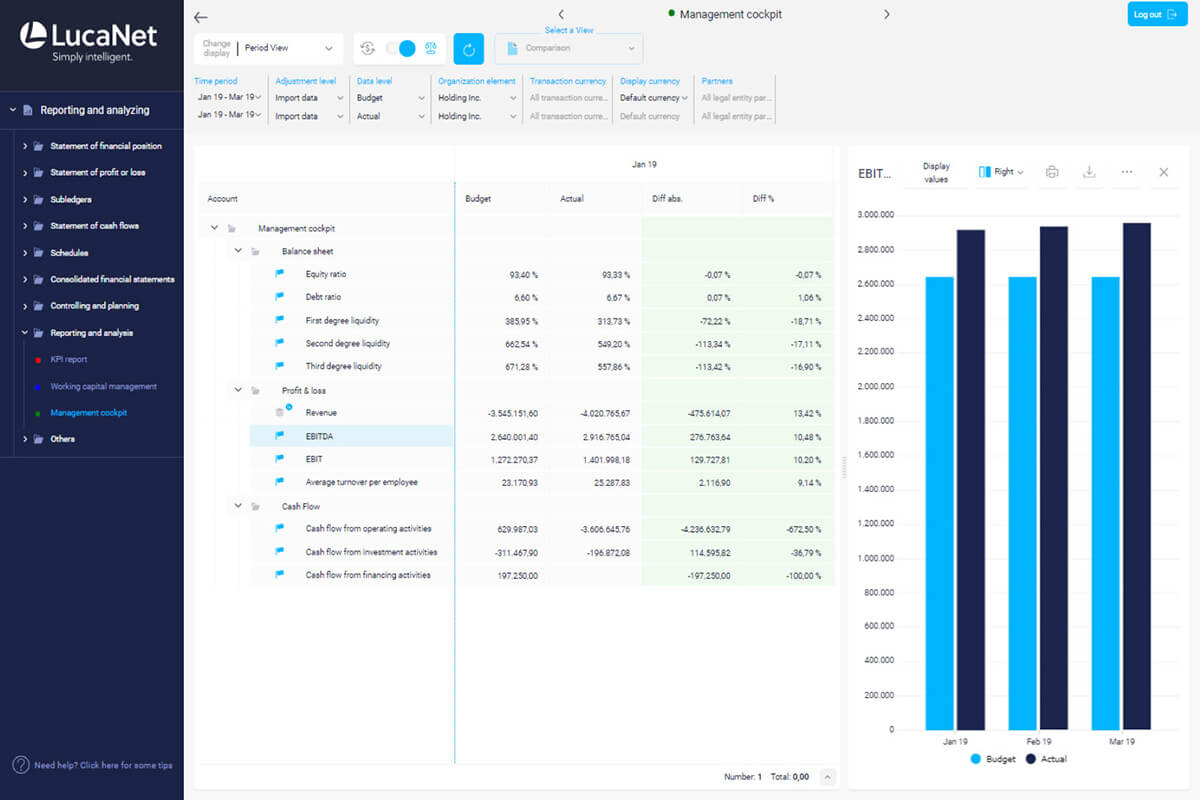
- Take advantage of freely configurable views for comparing actual and planning figures, as well as figures for forecasts, scenarios, and previous years.
- A wide array of configuration options is available within the reporting software, including sparklines and colored columns.
- Once defined, views are directly accessible in the tool from every structure and evaluation (in the balance sheet, P&L, or KPI areas, for example).
- It's also easy to create separate columns for comments (such as when deviations occur).
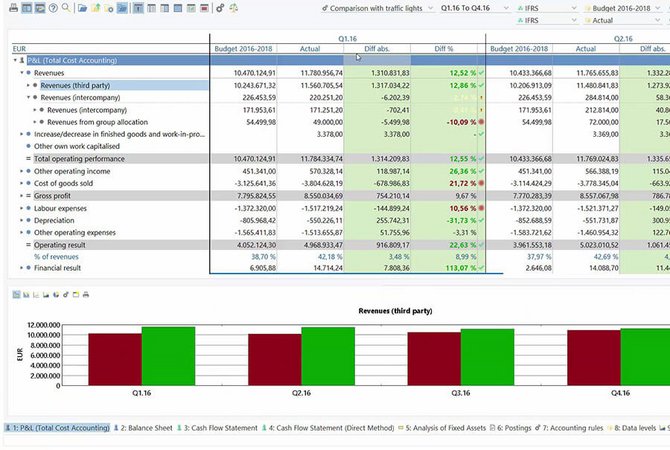
- Add a traffic light function to your comparison views.
- You can bring up ad-hoc graphics (with various types of diagrams) for easy visualization of any report.
- Graphics update dynamically when an item or time horizon is changed.
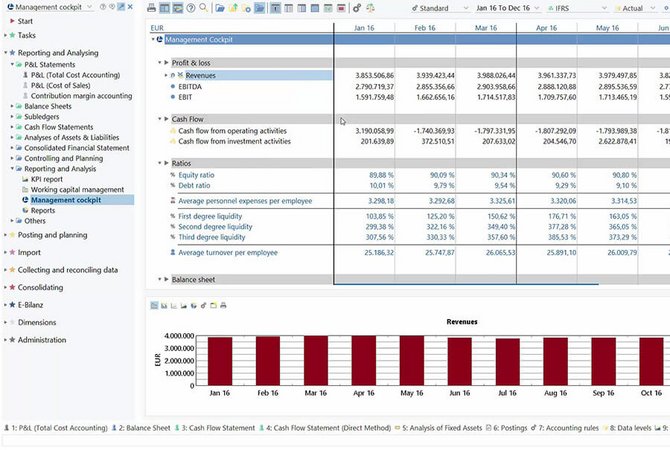
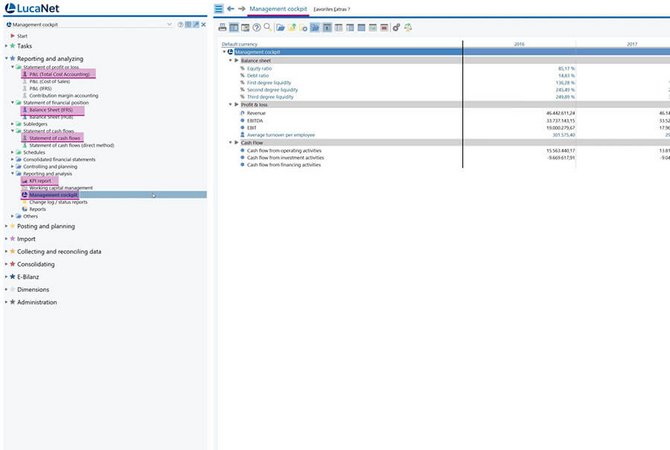
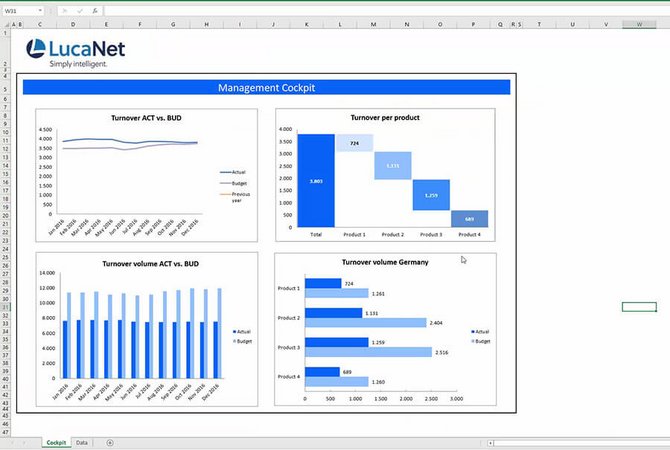
- The freely configurable management cockpit within the software can be used to create a workspace that makes the most important information from all areas available at a glance.
- Take advantage of all the evaluation options provided, such as views, comparisons, comments, and graphics.
- Your management team will have read access to this special workspace.
- Create standard reports directly from your LucaNet software.
- You can design the report templates however you wish (in MS Excel) and store them in the LucaNet tool.
- Selecting report parameters gives you a flexible way to make use of these templates.
- Comparison of key figures with graphical representation: In the Management Cockpit, the most important information is available at a glance.
- In addition to various comparison options, several graphics are available
- Read access is also available on mobile devices.
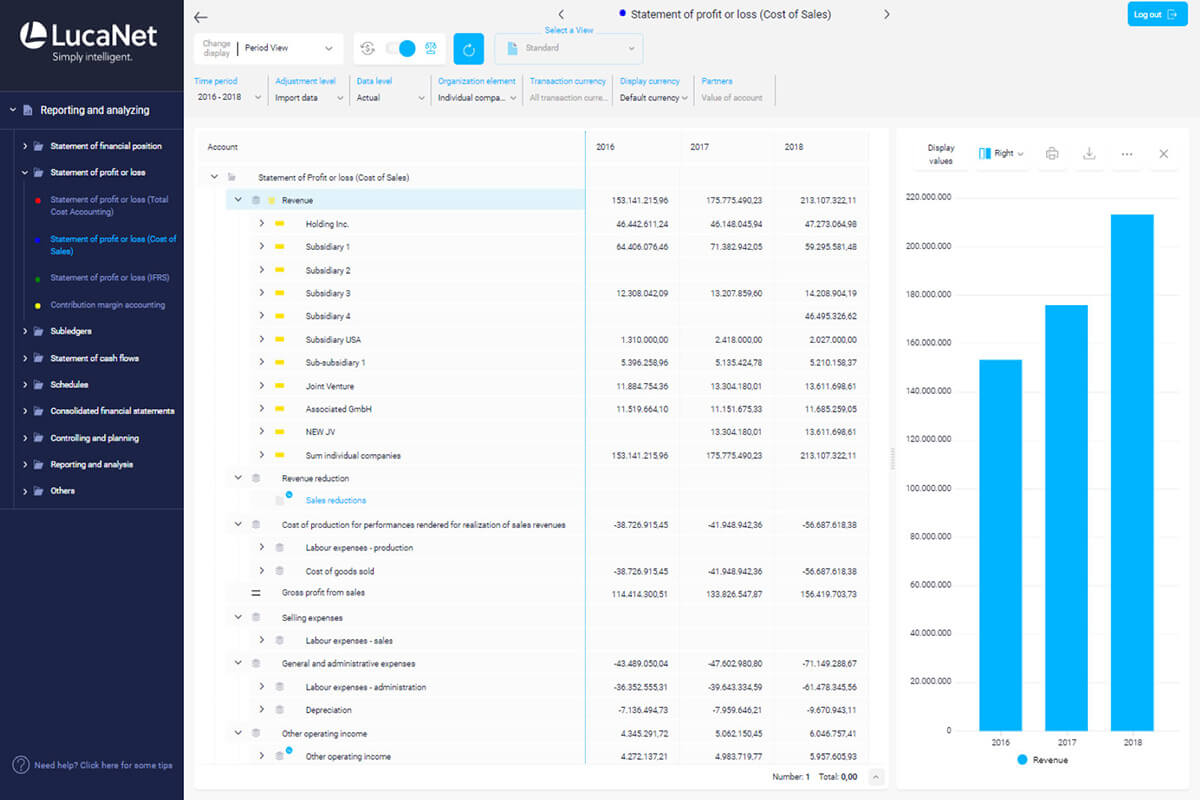
- All reporting structures can be displayed in different views, such as a simple time series view, drill-down in the group structure, or by cost center (groups).
- Various comparison options with sparklines or graphical views can be easily displayed in the tool.
- Mobile display via LucaNet.Web Client
The front end of the future
Use LucaNet.Web Client for mobile access to your data. Access your financial data in seconds via a web browser - whether on an iPad or Android tablet. This way your reports are available everywhere and at any time.

Learn even more about our management reporting software
Interested in seeing our reporting software in action? Are you also interested in finding out where and how LucaNet software can offer you support that goes beyond ad-hoc reports, KPI analyses, comparison views, time series analyses, and exchange rate scenarios? We’d be pleased to offer you a live, personalized demo with no obligation – either at your offices or in an online presentation!
Request Demo