How to utilize Power BI for Financial Reporting

On Feb 7, SGX has officially scrapped quarterly reporting requirements for listed companies. With SGX adopting a risk-based approach to Quarterly Reporting (QR), most SGX listed companies will be exempted from filing QR.
What does this change mean for companies and shareholders?
For many finance teams, the regulatory change calls for celebration. Companies can now focus more on long-term planning and analysis instead of juggling short-term goals to meet investors’ quarterly expectations. Companies can also save on high compliance costs, improve efficiency, and spend more time analyzing and strategizing.
The benefits to companies are obvious, but what would this change mean for shareholders?
Scrapping quarterly reporting comes at a huge risk. Without quarterly reports, companies risk reducing shareholder engagement. If listed companies do not undertake alternative measures of reporting, shareholders can only rely on semi-annual reports to assess companies’ performance.
These reports may be lacking in providing timely and comprehensive disclosures, in turn keeping shareholders in the dark. Bearing the risks in mind, how can companies reap the cost-saving benefits of this change, while capitalizing on it to boost shareholder engagement?
The next steps for companies involved
Based on SGX’s advice, firms are encouraged to disclose consistent and relevant information that is comparable across periods, given their market environment and their long-term strategy on a voluntary basis. This provides firms with higher flexibility in reporting as opposed to the standardized template required in the past.
For firms, this represents an opportunity to change the way investors consume information – all without involving high compliance cost, nor being restricted by formats that do not best communicate financials.
In short, firms are urged to continue updating and reporting their financials but in a format they deem most suitable for their respective businesses.
After all, the purpose for mandatory financial reporting is to connect internal and external stakeholders with quality reports that reduce information asymmetry
Determining the right reporting strategy
Companies must now determine a suitable reporting strategy. But with a variety of options out there, how can firms make the right decision?
Here are the key considerations firms should have in mind to help anchor their next reporting strategy:
- Communicating business performance should be objective-oriented, focusing on key metrics that truly drive the business. Based on the 20-80 rule, companies should aim to identify and report the 20% of key business metrics that drive 80% of the business performance.
- Financial reports should not be focused on satisfying shareholders. Financial reports are a vehicle to analyze past performances and identify future areas of growth. This in turn will provide valuable information to drive company performance and maximize shareholder value.
- Reporting is not meant to be costly.
How firms achieve quality reporting without increasing compliance costs
Keeping these objectives in mind, the challenge is to find a cost-efficient, yet timely solution to generate quality reports. Well, we are lucky as in today’s age, there are technology solutions built to empower the reporting process. A stellar example would be that of Microsoft Corporation.
Utilizing Power BI to redesign financial reporting
Power BI provides interactive visualizations and business intelligence capabilities for users to picture data via reports and dashboards. Here’s a visual sample of how Microsoft’s quarterly reports are communicated using Power BI:
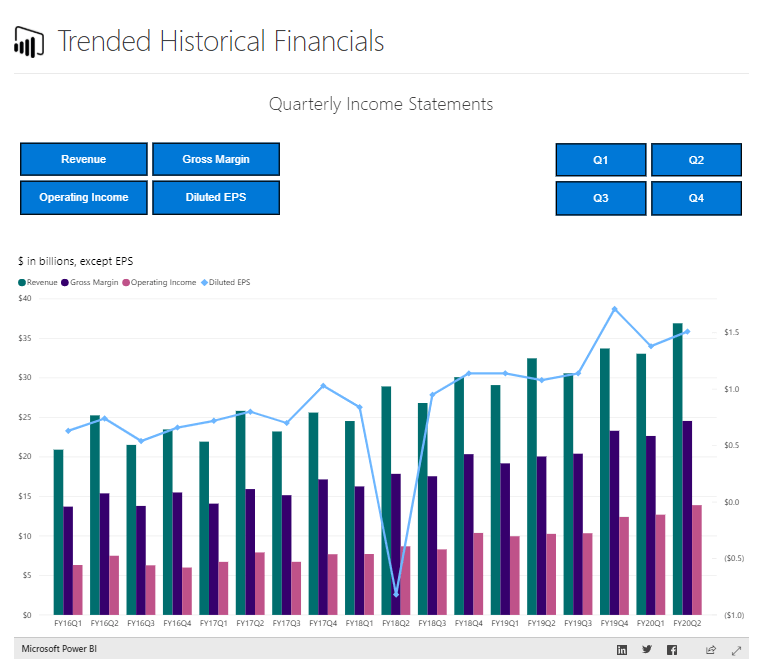
With reference to Microsoft’s Financial Dashboards, I have picked out some of the enhanced reporting capabilities achieved using Power BI:
1. Comparability
A single dashboard gives us a clear view of the values and trends of Microsoft’s performance over the last 5 years. At the same time, we can compare financials across different metrics such as Revenue, Gross Margin, Operating Income and Diluted EPS. Previously, a simple task like this would have required investors to download multiple PDF files and bringing the numbers into multiple custom spreadsheets.
2. Better signaling
Microsoft provides key profitability indicators and direct investors’ attention to focus on business drivers. Under Key Metrics, Microsoft has filtered data according to different business segments, product categories and channels. For example, under their Productivity and Business Processes and Intelligent Cloud, investors are now able to distinguish business performance for different product categories such as Office Commercial vs. Office Consumer products, Dynamics products, LinkedIn revenue and many more.
Comparing this to the traditional disclosure methods, most companies could only provide trend analysis up to revenue by segment or countries. Microsoft is now able to signal to investors which product lines are doing better over the years and their respective channels to help investors measure the performance of overall strategy the company is undertaking.
For a company like Microsoft with a diverse range of revenue generators, these numbers can provide better signals to the company’s performance.
3. Lower compliance cost
With Power BI, a single dashboard can offer users with multiple views of their financials. Power BI’s interactive interphase allows users to take a self-service approach in obtaining data that is the most relevant to their analysis. Simply put, with just a few clicks, users can generate a tailored financial performance report.
I believe we all had to juggle multiple versions of excel files for the same set to data just to present it in the different view for a different audience. With Power BI, the need for multiple versions and the cost of generating these reports in terms of lead-time and manpower is drastically reduced.
Another powerful feature of Power BI is its ability to directly connect to data sets. For end-users, once the setup is complete, a refresh button is all it takes to obtain the latest financials. Hence, the finance team can utilize the same dashboard for future years by simply refreshing the numbers, allowing reporting to be convenient and hassle-free.
Power BI in a nutshell
In summary, Microsoft’s investors are now able to adopt a self-service approach and generate reports in multiple dimensions for a more comprehensive overview of the company’s performance. The process of financial analysis is completely redesigned, bringing them an innovative and effortless experience. That is a huge gain to Microsoft.
Based on research, there is a positive correlation between stock performance and the quality of financial reports provided.
External stakeholders are not the only beneficiaries of Power BI. Internal management can also share the same experience by using this tool to build relevant management reports due to the flexibility brought by utilizing a single source of truth platform.
Now that we heard all the benefits of Power BI and how it can extensively help companies communicate their financials, I am sure many of you would be eager to get onboard. However, managing a BI project is not going to be an easy journey. In my next post, I will discuss the relevant steps and precautionary measures a finance team should take to achieving advanced reporting capabilities with Power BI.
In the meantime, you will find more information about Power BI on our detailed solution page.
